By Helen Maynard-Casely
We’re in the grip of a heat wave here in Australia and while the humidity rises at the coast, the heat never feels quite as oppressive in the drier air of the capital. The cicadas were in full song, clinging to the trees around Phillip Oval to herald Australian Capital Territory Meteors take to the field hosting Victoria in round three of the 2025/26 WNCL season.
This tie was probably the one least affected by losing players to the WPL, with only Meg Lanning and Millie Illingworth missing from the Victorian team sheet. Lanning has had limited impact on the WNCL this season so far, and Illingworth yet to have a run out – hence Victoria were probably very hopeful to break the spell of losses and get match points on the board.
ACT coaches had escaped the complications of those on WPL leave, though strike bowler Holly Ferling remains injured and in a moonboot after surgery. But overall ACT had great grounds to expect a win today, after showing good fight in a narrow loss away to last year’s finalists Queensland in the round before the long break in the season.
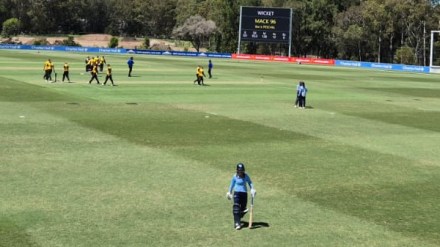
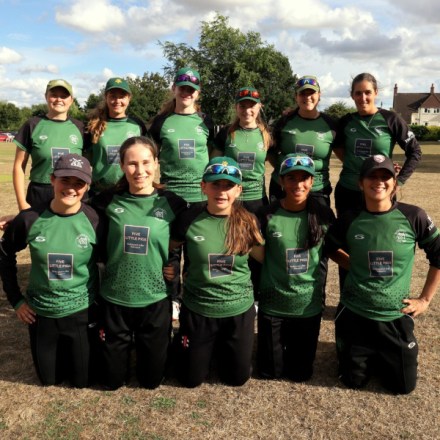
Player of the match Annie Wikman leads the successful ACT Meteors team from the side, flanked on the right by captain Carly Leeson.
It is a cliche, but the Meteors really did get off to a bright start to today’s match, with Nicole Fultum getting an inside edge that found the stumps off opening bowler Zoe Cooke first ball. This was followed a few deliveries later with Victorian captain Sophie Molineaux doing sinisterly the same thing. In the third over Cooke managed to trap Sophie Reid LBW, and the Victorian innings was in tatters at 3 down for only 6 runs.
Victoria saw some reprieve from total obliteration via a gritty 9th wicket partnership of 53 by Rhys McKenna and Molly Strano. Mckenna, who went on to put on 62 at a run a ball, looked in solid form – bringing up her 50 with a 6 lofted down the ground. But the team will be smarting that it could have been more – Hasrat Gil was just getting settled when she was run out at the non-striker’s end, courtesy of Anesu Mushangwe getting fingers to the ball sent down the ground by McKenna. Veteran Strano had also looked in good touch, before punting a full toss from Amy Hunter to the waiting mitts of Georgia Elwiss at mid wicket.
The Victorian innings was brought to an end at the beginning of the 37th over – ACT captain Carly Leeson had brought herself in to bowl, and the change up caused McKenna to not angle her shot down enough, allowing Mushangwe to take a low catch at mid-wicket, all out for 161. Cooke and Amy Hunter were the pick of the ACT bowlers, both netting 3 wickets with steely economies.
Low totals, it is said, can be tricky to chase down, and ACT had a few stumbles along the way. A quickfire 50 off 51 balls from Leeson did much to steady the nerves, at times it looked like she was orchestrating the fielding placements more than Sophie Molineaux. As they shuffled the field in response to one Leeson shot, she would then place the next neatly in the hole just left, leaving Victorian fielders scuttling back. Leeson, however, was felled the next ball after achieving the half century – caught off of Tess Flintoff’s pacy full toss. This was the third in a series of wickets, Bowlder and Elwiss departing previously for only 4 runs scored, leaving two new batters (Grace Lyons and Annie Wikman) and still 86 runs to get. But this was only the 15th over, and the ACT batters used this to their advantage. Wikman in particular built a lovely innings, able to sit back and pick out the boundaries when suited her. This culminated in a stylish reverse sweep to the boundary the 34th over to finish off the chase, and left Wikman on 62 not out, rewarded as player of the match.
The Meteors will be very happy with their first home game of the WNCL season, picking up a win and a bonus point to boot. The one concern for Thursday’s match will be Grace Digham who had to retire hurt while supporting Wikman’s batting, she pulled up after stealing a single which looked like a hamstring issue. Victoria still are in negative points after five matches played, will be onto yet another plan to try and fashion a win.

Be Alert! More cricket incoming on Thursday, when the next match of the round takes place.
Helen (Crystallised Cricket) is a writer based in Dharug and Gundagarra country, and here is writing about a game played on Ngunnawal country. She acknowledges the traditional owners of the lands that she writes from.