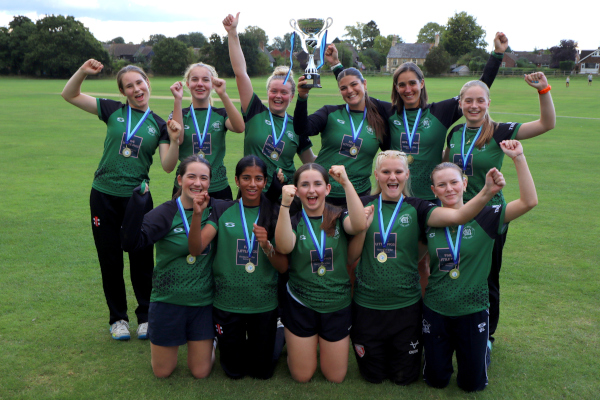
North Moreton near Wallingford (population 328) has had a cricket club since 1858, but it took until 2011 to start a women’s team, and a further 2 years before they won a game.
Fast forward to 2024 and Moreton Mavericks, as the club are known, have now won The Home Counties Women’s Premier League. Defeating some of the biggest cricket clubs across five counties is a true “giant killing” performance by the South Oxfordshire team, and they lost just one match in the process, finishing 32 points clear of their nearest rivals.
Club President Mike Howat said: “The growth of the women’s section at Moreton has been a truly remarkable story and we now compete successfully with clubs of a much higher profile and status.”
26 different players, with an age range of 14-46, contributed to winning this title. Captain Georgia Haworth (23) said: “I am hugely proud of all the players who have helped us become Home Counties champions; it’s been a real team effort from everyone involved.”
Celebrations continue in their clubhouse, which is actually the village pub, The Bear of North Moreton, handily overlooking the pitch.
If you are interested in joining the club, based near Wallingford, please contact Tim Haworth tim@busbar.biz
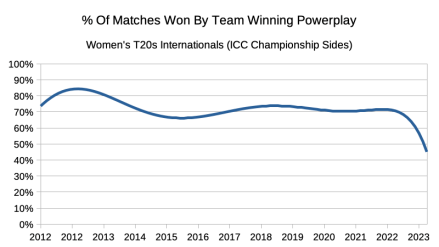
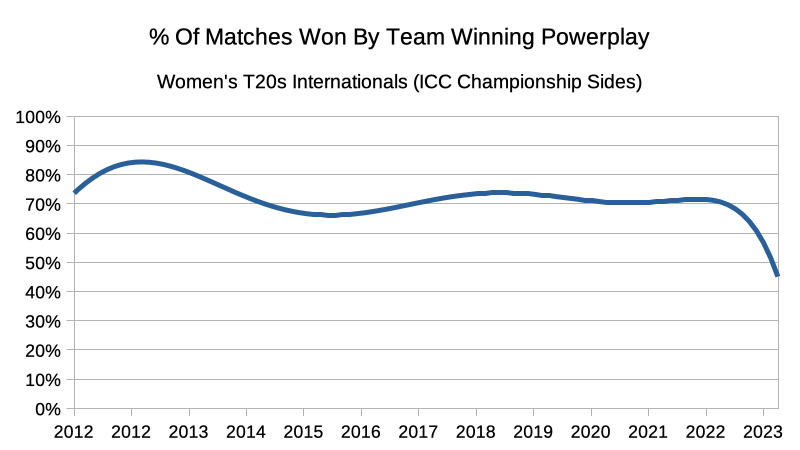
During the recent England v New Zealand T20 series, Alex Hartley observed on comms that for the first 4 games in the series, the team that had “won” the powerplay went on to lose the match. This was definitely an interesting titbit. In the entire history of T20s between the sides that now make up the ICC Championship, the team that won the powerplay went on to win the match 72% of the time.
One of the other commentators then went on to assert two further things.
That there had been a recent downward trend in that number.
That this was due to improvements in middle-order batting.
Let’s look at the numbers! (For the mathsy among you, this is using a polynomial trend.)
It is true that there has been a distinct downward tick recently – for several years, from 2014 to 2022, the number hovered at around 70%, but has now crashed down to below 50%, so it does look like something is going on.
But… is it?
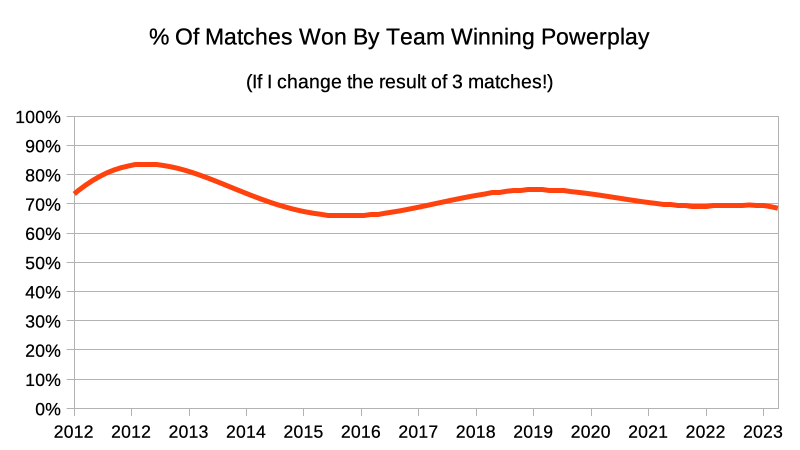
Although we are talking about hundreds of matches overall, hundreds aren’t actually very big numbers in stats terms, especially when you are looking at trends like this. So although the downtick shown here looks fascinating, it might not actually be very significant.
In order to illustrate this, let’s look at what happens if I change the results of just 3 recent matches.
If the outcome of as few as 3 games had been different, that startling downtick completely disappears, and we are back at the long-term trend of around 70%!
So to conclude, although there is a recent downward trend in the relationship between winning the powerplay and winning the match, it is probably just “noise”. The number fluctuates up and down – this is the “down”, but it will go up again, and there is no exciting new trend. (Sorry commentators!)
Moving on to the commentator’s second point, and admittedly somewhat more subjectively, even if it is not noise, the idea that it is due to improvements in middle order batting is palpably not upheld by what happened in the England v New Zealand series.
In the games New Zealand lost, they won the powerplays because they went of at 90mph, like that kid on parkrun who always sprints to the front at the start, but their middle order was completely unable to maintain that pace, so they fell off a cliff in the middle overs and went on to lose the game. Furthermore, in England’s case the game they lost was also due to a middle order collapse.
There definitely have been trends in batting over recent years, most obviously in the absolute number of runs scored; but this doesn’t appear to be one of them: the team winning the powerplay usually goes on to win the match 70% of the time, and the likelihood is that it will stay that way.
The current breed of talented girls owes it to the Women’s Cricket Association of India (WCAI) and the people behind it. That is where the saga of women’s cricket started to unfold, around five decades ago.
By Medha Godbole
As Harmanpreet Kaur, Smriti Mandhana and the rest of the players proudly displayed their well-deserved Asian Games Gold medal for cricket, one cannot help but thinking how far women’s cricket in India has come. Although it is still just in its teens and there is still a lot to be cheered about. But it is safe to say that the current breed of talented girls owes it all to the Women’s Cricket Association of India and the people behind it. That is where the saga of women’s cricket started taking shape, around five decades ago.
Circa 1973 – The Women’s Cricket Association of India (WCAI) was registered by Mahendra Kumar Sharma, the founder secretary in Lucknow, India, under the Indian Societies Act. Even though since early 1970’s, women had been playing cricket, there was no organisational set up for the game before WCAI. Girls who played hockey and softball were the obvious choices to be picked to play cricket. The first president of the WCAI was the late Begum Hamida Habibullah. She was the face of women empowerment in post-independence India.
The same year, in 1973, WCAI became a member of the International Women’s Cricket Council. This probably doesn’t seem to be of too much consequence now. Although at that time, it was huge, and the matches garnered a decent number of spectators. Under the leadership of Habibullah, initially, for the first few years, there was considerable hustle and bustle. They were playing for almost nine months in a year. Three teams participated in the the first women’s inter-state nationals – Uttar Pradesh, Maharashtra and Mumbai held in 1973.
From three teams in the first inter-state tournament to more than ten in the third, held at the then Kolkata (earlier Calcutta), it was a big leap for the association as well as involvement of women in the sport. The first ever international test match was held at Pune between India and Australia in 1975. It is another story that the match was considered to be an unofficial affair. This was followed by India’s matches with New Zealand, England, and West Indies, both at home and overseas. Interestingly and ironically enough, despite the lack of awareness and general apathy towards women’s cricket, the touring teams were surprised to see a large number of spectators. This was something they had never experienced at home. Perhaps one of the reasons could be that in India, the matches were held at regular cricket stadiums whereas abroad they were played on club cricket grounds. The WCAI functioned efficiently under Anuradha Dutta, 1991 onwards. The trend continued, 2002 onwards with Shubhangi Kulkarni as the secretary.
Of course, the WCAI was responsible for pumping in the money via its stake holders. According to one of the former India players, who has seen the working of the WCAI closely, the volunteers and officials often pumped in their own finances to make sure that the girls got to play. In fact, the WCAI hosted the 1997 Women’s World Cup in India with the financial backing of local businesses.
Much was achieved by the WCAI for women’s cricket and there was a lot of activity in the first decade or so after its establishment. However, around the early 1980s, things took a downturn. Shantha Rangaswamy, a former allrounder and Indian captain and an Arjuna Awardee (1976-1991) and Shubhangi Kulkarni (former India Captain, and Arjuna Awardee) both look upon the period of 1986 to 1991 as that of lull. There was barely any cricket played. Rangaswamy and several other doyens of sport like Diana Eduljee, Ujjwala Nikam had to endure this tumultuous time. It was tough because all these immensely talented players had to twiddle their thumbs in their prime, without any action on the ground. Upon a bit of digging, it was known that there were issues between the then WCAI secretary and the concerned minister of sports.
But one wonders, considering that, women’s cricket in general seemed to be in a better position in India in the 1970s and 1980s, why did it take almost eighty odd years for it to merge with BCCI? The BCCI, we have to note here, was formed in the late 1920s. One aspect of the answer seems to be obvious. Popularity and money were not the adjectives which were associated with women’s cricket. Lucrative was not something women’s cricket was believed to be. However, the WCAI became a member of the International Women’s Cricket Council (IWCC) in 1973 and received the government’s recognition in 1978. After the BCCI started administering the sport, at the beginning of 2000, things were looking up. Although, the WCAI was left to its own devices for a while. Lack of resources was a major issue while those who played or represented BCCI as players got better opportunities and treatment.
The amalgamation or the merger of WCAI into BCCI happened in the year 2006. By that time, the International Cricket Council, which had already taken the IWCC (International Women’s Cricket Council) under its aegis. Kulkarni surmises that it was probably because for cricket to be included as a part of the Olympics or Commonwealth Games, there had to be a single governing body for the sport. This brought about a sea change in the playing conditions for the players. Things like match fees, hotel accommodation and proper train reservations came into the picture.
But all this would not have been possible if it were not for late MK Sharma’s resilience and his support for women’s cricket. A chance sighting of girls from a softball team playing cricket on a railway platform in India spurred the formation of WCAI. Talking about the setting up of WCAI, Kulkarni mentioned that MK Sharma was a visionary when it came to women’s cricket. A coach himself, then, he was pivotal in getting an organized set up for this sport with reference to women in the country. Before that, it was pretty much scattered. He did not falter from his objective no matter what anyone said. Men like him were made fun of and girls too were ridiculed and cast away. In a predominantly orthodox society, like India, girls wielding bats was blasphemy. They were supposed to get married, have children and take care of the household, not go around running behind a leather ball in shorts or skirts in front of people.
The similarities between what Women’s Cricket Monthly magazine by Marjorie Pollard did for the cause of women’s cricket in the United Kingdom and by cascading effect across the globe and the WCAI for women’s cricket is uncanny. The WCAI nurtured some of the best women cricketers over the years. The solid foundation laid by the association ensured that generations of girls would be able to build their careers on it. For that, innumerable cricket connoisseurs and future Mithali Rajs or Shantha Rangaswamys in India will always be indebted to.
Welsh Fire twice set a new record for the highest first innings score in the women’s Hundred. There were 5 scores above 150 (compared to 7 in 2022 and just 2 in 2021) and 2 under 100 (compared to 3 in both 2022 and 2021)
However, the average (mean) 1st innings score was 129 (one and ‘a bit’ runs higher than 2022), which was disappointing for advocates of longer boundaries (which were seen at most grounds this year, although not always at Cardiff). The argument ran than bigger boundaries would address the binary “1 or 4” scenario which small dimensions impose on many batters without adversely impacting boundary hitting.
In this year’s tournament 55.6% of all runs came from boundaries (46.1% 4s and 9.5% 6s) compared to 57.7% last year (47.6% 4s, 10.1% 6s); so, whilst the second part of the theory was proved correct, the hoped-for increase in 1s and 2s didn’t materialise. Having watched every game there wasn’t any single explanation – a general lack of game awareness (many potential 1s and 2s weren’t taken), poor batting (inability to work the ball into gaps) and/or fitness levels all contributed.
Men’s and women’s scores compared
There are many differences between the men’s and women’s game and it doesn’t follow that scores (or their composition) should be the same. Nevertheless, comparisons can be useful if they either draw out systemic differences or alternatively if they highlight areas where the women’s game can seek to improve.
Stop hitting the ball in the air!
Total sixes hit were 111 (102 in 2022; 91 in 2021) and the biggest hitters in the women’s game, such as Smith (top with 8), Devine and Dottin can clear any boundary. But only 9 batters hit more than five 6s; up from 6 last year (102 6s) and 4 (91) in 2021.
For comparison, the men hit 355 6s and 28 male batters hit 5 or more 6s, the top 2 both hitting 17.
165 women batters were out ‘caught’ by fielders other than the keeper i.e., there were 1.5 dismissals ‘caught’ by a fielder other than the keeper for each 6. (This isn’t to say that every batter who’s out ‘caught’ is trying to hit a 6 but it is a useful proxy.) 214 men batters were out ‘caught’ by fielders other than the keeper i.e., 0.6 dismissals caught in the field for each 6 hit.
Simplistically, the men hit 3.5x more 6s than the women and the women lose 2.5x more wickets for each 6 hit which leads to a fairly obvious conclusion …
… those women batters who are able to clear the boundary should carry on but, on a pure risk:reward basis, the vast majority would be better advised to eschew aerial shots.
Boundary hitting – the impact on team scores
For this next piece of analysis, we need to make 2 assumptions (i) bowling standards were the same in both tournaments (i.e., male and female bowlers bowled the same percentage of ’bad’ or ‘boundary’ balls), and (ii) any ball that could theoretically be hit for a 6 could instead be hit for a 4.
As already mentioned, there were 111 6s in the women’s tournament and 355 in the men’s. However fewer balls in total were bowled in the women’s tournament so, on a pro rata basis, the men would have hit 329 6s in the same number of balls i.e., 218 more than the women (= -1308 runs impact).
The women however hit more 4s than the men – 811 vs 734. Making the same adjustment for the lower number of balls bowled, the men would have hit just 680 4s (i.e. 131 fewer); meaning that 60% of the 218 ‘bad’ balls which weren’t hit for 6 were still sent to the boundary (= +524 impact)
Finally, you also need to consider what happens to balls which aren’t hit to the boundary. These went for 0.75 runs per ball in the men’s games and 0.68 in the women’s; meaning that the remaining 87 ‘bad’ balls which weren’t hit for a boundary would go for 59 runs.
The net runs difference would thus be …
(-1308 runs in 6s) + (524 runs in 4s) + (59 runs off balls not hit to the boundary) = 725 runs.
… which equates to approx. 12 runs per innings.
Top run scorers and batting strike rates
What could teams do to increase scores?
Men
Women
Batters with the most runs
Runs / % of all runs
SR
Runs / % of all runs
SR
1-8
1972 / 23.5%
155
2074 / 29.4%
143
9-16
1469 / 17.5%
155
1307 / 18.6%
119
17-24
1119 / 13.3%
139
1027 / 14.6%
120
25-32
1024 / 12.2%
144
810 / 11.5%
120
33-40
841 / 10.0%
137
607 / 7.3%
117
41-48
654 / 7.8%
126
472 / 6.7%
121
49-56
484 / 5.8%
126
319 / 4.5%
111
Interestingly, the top 24 batters in each tournament collectively score very nearly the same number of runs.
But this dramatically illustrates the disproportionate reliance of the average women’s team on their top one or two batters. In men’s cricket, a team can lose a couple of top order wickets and this hardly impacts their SR wheras in the women’s game, after the top 1 or 2 batters it becomes almost largely irrelevant which batter is in since typical SRs hover around 120 regardless.
The route to higher scores …
More 1s and 2s. Game awareness needs to improve. It might be argued that having more fielders in the ring makes it harder to score singles, but the counter-argument is that there should be more 2s if balls are hit through the gaps thus requiring an inner fielder to turn and chase or interception by an outer fielder (each of whom has to cover a greater percentage of the outfield than in the men’s game).
On average women’s teams lost only 5.7 wickets in the first innings (a number which has actually gone down each year of the Hundred) and reached their halfway score at 52 balls (i.e., there was rarely a surge at the end of an innings). The main explanation is that most teams are far too reliant on their top few batters who thus daren’t risk exploiting the powerplay because the consequences for their team’s score are too big if they get out early.
I floated one idea last year how teams could accommodate the realities of top batter dependency and go harder during the powerplay if they utilised ‘attritable openers’ – a role with no equivalent in the men’s game – whose only job is to score [typically a small number of] runs very quickly without consideration for their wickets. This could be bowlers ‘with a good eye’ or the lower-middle order batters who currently get no/little chance to bat. With more chance of facing ‘pace on the ball’ and one less outfielder to beat this could present huge opportunities for anyone willing to take on such a role.
Note that 9 times this year teams came within 10 runs of a successful run chase (5 times chasing 137 or less). If chasing teams could marginally increase the run rate off non-boundary balls and deployed a couple of attritable pinch hitters with SRs of 150+, the combined effect of these 2 minor changes should change the result in most of these games. Conversely, a team batting first and using the same tactics could post totals beyond most oppositions far more regularly.
And what should bowling teams do?
As already noted if you take out most team’s top 2 batters, the subsequent batters are unlikely to hurt you with their SR and hence the principal task is no longer taking wickets but restricting the runs.
So which bowlers had the best SR?
S Munro
AC Kerr
LF Higham
S Glenn
GL Adams
FMK Morris
MLL Taylor
S Ecclestone
GA Elwiss
M Kapp
KA Levick
S Ismail
EL Arlott
R MacDonald-Gay
KL Gordon
LCN Smith
(NB Munro and Taylor both played 2 games.)
And then consider then the 16 bowlers with the lowest ER.
M Kapp
S Glenn
FMK Morris
KL Gordon
HL Baker
S Ecclestone
LCN Smith
CE Dean
KA Levick
GL Adams
S Ismail
K Moore
EA Burns
SAE Smale
A Wellington
LF Higham
Notice anything? Whether you want to take wickets or stifle runs, ‘slow is the way to go’ (a tactic which served Sri Lanka well in the T20s). If the women’s game is to evolve its own distinct tactics then unless you have a tall speedster or one skilled in variations / swing then abandoning the convention of having two or three seamers in your squad is a logical step. Why not have one fast bowler and 5-6 slow bowlers?
Birmingham Phoenix or Manchester Originals – please feel free to adopt any/all of these strategies next year.
Part 3 of 3 in a series reflecting on WBBL08 by guest writer Andy Frombolton
Who gives a (bat) flip?
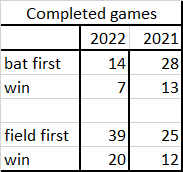
Received wisdom is that batting second in T20s constitutes a considerable advantage. However this presumes that teams are good at chasing. And also that team strengths are broadly equivalent .
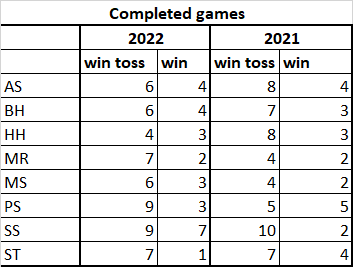
What’s the WBBL data when teams win the toss?
Thus on average teams win half the time whether they bat first or second but behind the headline figures are some big differences by team in terms of strategy and success. For example, in 2022, Renegades won the toss 7x, fielded 7x and lost 5x, whilst Stars won the toss 9x and fielded first every time (3 wins, 3 losses, 3 NR).
If any team displays a strong preference, it’s fairly obvious what the oppositon is going to do when they win the toss. Also, if a team’s whole strategy is built e.g. around chasing, how will they ever develop their ability to post a score?
Most interesting is Sixers’ transformation from the least-successful flippers to the best. In contrast, Scorchers went from winning every game when they won they toss last year to losing two-thirds in 2022!
The bat flip doesn’t really make much of a difference – the best teams tend to win whether they bat or bowl first and vice versa.
All-rounders
Professionalism will invariably decrease the viability of someone being an all-rounder since to be a world-class batter or bowler will require specialism for all but the most gifted.
Hence genuine all-rounders will be increasingly rare and conversely desirable in team selections.
How many players make it into the top 25 lists (most runs and most wickets), and who are they? Some of the answers may surprise …
Long term presence Devine had a poor season – a SR of less than 100 (compared to a usual 128+) and just 8 wickets. McGrath just missed out on batting honours (26th) but injury precluded her bowling as much as previous years.
Knight (2020), like Edwards and Root before her as England captains, has tended to underbowl herself. It’ll be interesting to see whether she bowls even less after her hip-surgery which would be a great shame since she’s an (undervalued) all-rounder.
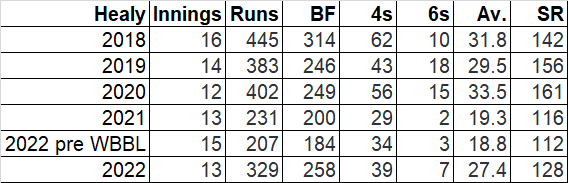
Career resurrections – Perry and Healy
Going into this tournament the T20 careers of both these great players looked like they were in terminal decline when you looked at their WBBL performances. Perry didn’t make the CWG squad but found some form in The Hundred, whereas Healy’s miserable WBBL07 form continued right through until this tournament.
(2022 stats include all T20s for Australia and The Hundred)
Beyond the treat for all cricket fans of seeing these two on the world stage for a bit longer than they might have feared, the broader message is that older players can adapt their games for the modern game.
As discussed in Part 1 Perry, Jonassen and Kapp are great examples of how many older players could be much better deployed in the middle/late overs using their great game experience to pace and judge the innings and with the freedom to play which this new role could bring.
Wicket-keeping standards
In the women’s T20 game, keeping is as much about keeping batters in their crease as taking stumpings but far too few keepers appeared confident in going up to the stumps for the medium pacers. Healy (and previously Sarah Taylor) repeatedly showed how it limits many batters’ options.
Overall though too few of the keepers are athletes – tending to remain fairly static and waiting for a return over the top of the stumps. Keepers need to ‘own’ the area behind them 20 degrees either side of the stumps and whilst comparisons with the men’s game aren’t always relevant in this instance there’s no reason why the best women keeper can’t emulate the standards of the best male keepers who regularly beat fielders not wearing pads to snicks and tickles heading for the boundary.
Heaven help the opposition when Australia finally select the Harris siblings
Their stats say it all.
Is there any other country where Laura Harris wouldn’t be in the national team by now?
Pedestrian powerplays
The average figures were:
23.9 for 1 wicket 1st innings
23.6 for 1.1 wickets 2nd innings
In the first innings, 6 of the teams hovered around the average. Sixers were the only team with a materially better average PP (27) and Thunder the only team with a materially worse average PP (20).
In the second innings the stats were slightly more spread out, Hurricanes and Thunder both had materially better average PP (28). Heat had a materially worse average PP (19). But the surprising outlier in all the data was Sixers with an average PP of just 16!
Overall, these figures are far too low. The PP should be the launchpad for the innings but as discussed the batters either don’t have the skills (or feel they can take the risk) to take on the bowlers and take advantage of the fielding restrictions. The answer is simple – either the current batters need to change their mindset or teams need to deploy different openers.
And finally … the ultimate TFC
In the shorter format there will inevitably be squad members who don’t get the opportunity to do much with the bat or ball, but one player’s figures stood out above all others this year. Angelina Genford of the Sixers: 15 matches, 3 innings, 7 balls, 4 runs and 3 separate bowling spells totalling 4-0-36-1.
Part 2 of 3 in a series reflecting on WBBL08 by guest writer Andy Frombolton
Teams posting 140 or less lose 3/4 of their games. Hence any bowling attack which can regularly restrict the opposition to this figure will win the vast majority of games. Chasing down 140 requires a collective SR of just over 110 (well within the capability of even the most pedestrian batting line up) whereas restricting teams to such a low total is much harder.
Hence this article posits that when assembling a team the priority should be securing the best bowling unit.
This is the total opposite of what happens today, with teams competing for the best domestic and international batting talent and generally being far less interested in ‘pure’ bowlers (especially overseas bowlers). The other noticeable theme is how many uncapped players feature in each year’s Top 25 wicket takers list (or conversely how often ‘marquee’ names disappoint).
YEAR
NUMBER OF FORMER AND CURRENT* INTERNATIONAL PLAYERS IN TOP 25 WICKET TAKERS
2022
AUSTRALIAN
8
OVERSEAS
4
2021
AUSTRALIAN
10
OVERSEAS
3
2020
AUSTRALIAN
7
OVERSEAS
7
2019
AUSTRALIAN
13
OVERSEAS
3
2018
AUSTRALIAN
7
OVERSEAS
5
* as of the relevant season
So, who were this year’s highest wicket takers?
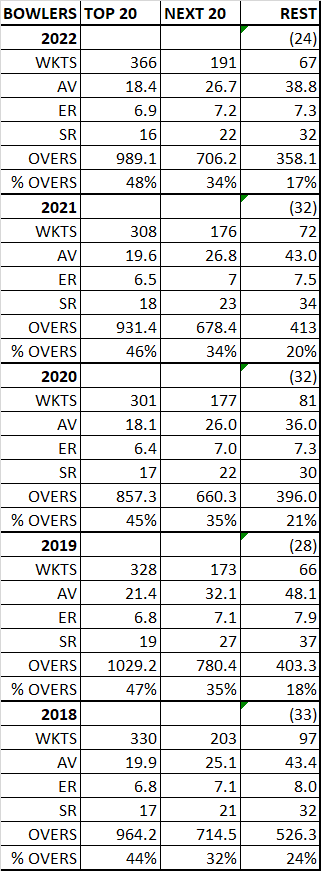
What then constitutes a good bowling unit?
The first point is that, as noted above and unlike batting, international bowlers often don’t deliver the sort of performances expected. The stats are damning – in the past 5 seasons only 4 international bowlers (as opposed to all-rounders) have made it into the table of ‘Top 25 wicket takers’ (Tahuhu 2018, Glenn and Ismail 2020, Ecclestone 2022) (And Ecclestone should be an all-rounder!). So unless a team can secure the services of one of the top 3-4 overseas bowlers in the world the evidence suggests they’d be better off saving their money.
Equally interesting are the Economy Rates (ERs). Shouldn’t the ‘best’ bowlers have better ERs than the other bowlers? In fact, the ERs of the top 20 wicket takers, the next 20, and of all other bowlers are virtually the same and converging. In the past 3 years, the best bowlers are going for slightly more runs, the ‘change’ bowlers are holding steady and the bits’n’pieces bowlers are bowling less but becoming more economical.
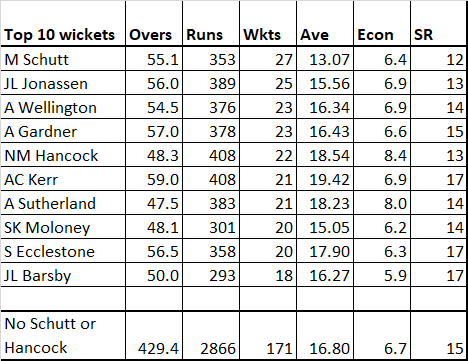
Running counter to the men’s T20 game (where slow bowlers dominate the best ER tables and faster bowlers the best SR tables) the 2 best* (*rationale follows) bowling attacks in this year’s tournament (Adelaide Strikers and Brisbane Heat) employed very different approaches.
Adelaide Strikers: Schutt (fast), Wellington (slow), Barsby (slow), D Brown (fast) and Dottin (fast medium).
Of these, the hitherto-unspectacular Barsby was a revelation and is additionally interesting for being one of the new breed of ambidextrous slow bowlers (her occasional left arm accounting for Alice Capsey in one game).
Brisbane Heat: Jonassen (slow), Hancock (medium), A Kerr (slow) and Sippel (medium).
More important seemingly than the composition of the attack is that bowlers know their role and learn to bowl as a unit, which is what makes Adelaide Strikers truly unique – their 5 main bowlers bowled 92.6% of their overs i.e., the same 5 players bowled their full complement of overs in virtually every game. The closest analogy I can think of is the all-conquering Gloucestershire men’s side of the early 1990s. Similarly Heat had 4 bowlers who delivered 72.1% of their overs. Contrast this to Sixers whose core 3 bowlers always bowled their full allotment (59.4% of overs) but the bulk of the balance was shared between 4 bowlers. Sixers might counter that their approach demonstrated flexibility and greater depth in their bowling attack.
This is another area where performances in the women and men’s game diverge and hence so should tactics. In the men’s game, the best way to slow down the run rate is to get the top batters out (such is the difference in the SR of the top 4 batters compared to the next 4) which means teams need strike bowlers to perform this role (their ER being of less concern), but in women’s cricket (as discussed in the previous article) overall batting SRs are lower and hence dismissing a top batter has less impact (quantum) on a team’s eventual score.
Thus if bowling SR was the key determinant of an opposition’s score then Sixers might have a claim to have the most penetrative bowling unit. Sixers have 5 of the 23 bowlers (≥5 wickets) with a SR<20 with all the other teams having 3 (except Renegades which had 0, which perhaps explains why they conceded the 1st, 2nd and 4th highest scores in this year’s tournament).
But if instead keeping the run rate down is the priority, then a team needs a bowling attack able to do this consistently in all scenarios. Strikers’ top 4 bowlers had a combined ER of 6.4; far better than any other team and only once did a team batting first get on top of them (Stars’ 186, 3rd highest score of this season), otherwise they conceded 4 scores in the range 151-154 and 4 in the range (101-114). And when defending Strikers never got hit for more than 139.
Based on consistency and dependability, Strikers were the best bowling team and thus deserved champions.
The silver bowling award goes to Heat who bowled well in the first innings (only once conceding more than 140) but conceded more than 156 four times bowling second. It was their potential to wilt under pressure (not helped by some poor fielding at key moments) which cost them games.
Sixers also got hit for above par scores five times (three times bowling first and twice bowling second, although they went on to win 4 of these games so could contend this was ultimately irrelevant. The counter argument is that no team, however good their batting line-up, can afford to concede these sort of scores.) Equally telling was the three times they got taken apart in the death overs and only clinched victory each time courtesy of some equally-brutal hitting in their final overs. (Game 1, Heat hit the last 2 overs for 18. Sixers hit 19 off 11 balls; Game 42, Scorchers hit 22 off the last 2 overs, Sixers hit 23 off 12 balls; and Game 49, Heat hit 37 off the last 2 overs (and 47 off the last 3) and Sixers hit 28 (and 41). Hence their honourable bronze position in these bowling awards.
In concluding, what therefore would be the perfect bowling attack look like?
Look again at the list of top wicket takers. The stats say it all. Slow bowlers dominate the wicket-taking tables – 8 of the top 10 (with a collective ER of 6.7 and a SR of 15).
So team selection should start with a fielding set up capable of supporting your bowlers – a superb keeper and a minimum of three fielders who are great in the deep (trading a degree of run scoring ability for fielding prowess if necessary).
You need a fast bowler? Schutt, D Brown, Sippel or Strano. No other fast bowler has appeared in the Top 25 for 2 years in a row so you’re just taking a gamble on any other selection having a good year.
Add 1 all-rounder (more on that subject in the third article)
And finally 3 slow bowlers (or even 4 so you don’t even need to play your fast bowler when conditions don’t suit).
Part 1 of 3 in a series reflecting on WBBL08 by guest writer Andy Frombolton
The average 1st innings score in this year’s WBBL (in complete games) was 145, up slightly on 2021 (137).
Teams posting 144 or more in the first innings won 22/29 times whilst teams scoring 160 or more won 14/16. But the distribution of above-par 1st innings scores was highly skewed – only 3 teams managed it more than twice: Heat (7 wins from 8); Sixers (6 wins from 7); and, Hurricane (3 wins from 5). In contrast champions Adelade Strikers never posted more than 147 but defended 4 scores in the range 140-147 (twice against the Sixers) and their highest score in 6 successful chases was only 156.
The most obvious conclusion is that it’s bowling units which win games, not batters. Nevertheless batters are the focus of this first article.
There were 24 first innings scores of 150 or more (compared to 17 last season) but more interesting is who’s scoring the bulk of these runs. Intuitively you might imagine it would be the players with international experience – and this certainly used to be the case.
YEAR
NUMBER OF FORMER AND CURRENT* INTERNATIONAL PLAYERS IN TOP 25 RUN SCORERS (*as of the relevant season)
2022
AUSTRALIAN
7
OVERSEAS
10
2021
AUSTRALIAN
8
OVERSEAS
10
2020
AUSTRALIAN
8
OVERSEAS
7
2019
AUSTRALIAN
10
OVERSEAS
13
2018
AUSTRALIAN
11
OVERSEAS
10
Slowly, uncapped players are being given, and are seizing, their opportunities. Disappointingly however this cohort (extensively coached in power hitting and 360 degree shot making) isn’t having the impact on run rates which might have been expected.
Top 25 run scorers WBBL 2022
(Orange – Australian former and current Internationals. Blue – former and current Overseas Internationals)
With the exception of Laura Harris, the uncapped batters are scoring their runs at about the same rate as the international players they’re incrementally displacing.
YEAR
TOP 20 RUN SCORERS
20 NEXT MOST RUNS
REST
2022
RUNS
6511
4274
3109
% RUNS
47%
31%
22%
SR
119
110
102
2021
RUNS
7301
3560
2231
%
56%
27%
17%
SR
116
103
95
2020
RUNS
6844
3383
2070
%
56%
28%
17%
SR
115
101
97
2019
RUNS
8457
4063
2497
%
56%
27%
17%
SR
121
108
101
2018
RUNS
7805
4452
2853
%
52%
29%
19%
SR
124
109
100
Most teams pack their top order with dependable batters who can be relied upon to get their team to the sort of total which will win most games (144 this year, as noted earlier).
But 144 only requires a collective SR of around 112 (assuming 10 extras per innings).
So, if you’re a former international or a fringe player seeking to secure a WBBL or Hundred contract why take risks trying to score more quickly – even against weaker bowling attacks – when a pedestrian 112 will be seen as a good innings? With this attitude team scores aren’t going to grow.
In their defence, the top order could cite some statistics which seemingly justify their cautious approach:
Bat
Result
% runs (off the bat) scored by batters 1-4
1st
Win
75.00%
Lose
53.00%
2nd
Win
77.00%
Lose
54.00%
This seems to suggest that the team won’t win unless the top order scores the bulk of the runs. But a lot of these victories batting second were in pursuit of low scores and hence inflate the average contribution of the top order. Watching teams slowly overhaul below-par scores was a scenario seen far too often this tournament.
More relevant then is to see how the top batters cope when presented with a more challenging target. If you take the average of a team’s 3 highest first innings scores as an indicator of what they’re capable of when they play well (‘batting potential’, ‘BP’) there were only 11 occasions (in full length games) when teams exceeded their BP batting second and only 4 times did this result in a victory.
The conclusion is that most teams simply don’t know how to chase anything above an average score – primarily because their top order is full of established players playing ‘old fashioned’ cricket. Powerplays are squandered and acceleration is too slow; leaving the middle/lower order batters too much to do if the top order fail.
Comparisons to men’s cricket aren’t usually helpful, but sometimes they can serve to shine a light on issues. Looking at 2021 Blast data, the average SR for the top 4 run scorers in each team was 141, 128 for the next 4 and 113 for the rest. This raises two questions: Firstly, why aren’t the best women batters able to achieve SRs more akin to the best men batters (Mandhana and Wyatt dispel any argument that physical size is the primary explanation) and, secondly, why are the tails so long? If batters 6 onwards can barely strike at 100, then it’s little wonder than the top order batters in most teams play so cautiously (knowing that if they fail, their teams have little chance of success).
Let’s look at this year’s (4 over) Powerplays. The average PP (both innings) was 24; equivalent to a SR100 (with only 2 fielders out). That’s not good enough.
Consider 6 hitting. There were 235 6s hit in this year’s competition but just 13 batters accounted for half of them. 46 batters didn’t hit a single 6 (including 4 of the top 25 run scorers) whilst a further 16 hit just 1 (including another 3 of the top 25 runs scorers). This means that 7 of the top 25 most prolific run scorers can’t clear the ropes. Perhaps they don’t take the aerial route? Well, 8 of the 25 (including 5 internationals) score less than 50% of their runs in boundaries – which is the average for the top 85 batters!
Why is this important? Because boundaries win games. In comparison the number of singles has barely any impact. (The same hold true in the men’s game.) The one exception was the Sixer’s (record) 66 singles to beat Hurricanes despite scoring 5 fewer boundaries. Next best (65) helped propel Stars to an truly-underwhelming 114 against the same opposition!
In this year’s WBBL, 42 of the 52 full length games were won by the team which equalled or hit more boundaries than the opposition. (Regarding the other 10 games, in 4 of these the winning team only hit 1 less boundary.)
The players who can hit boundaries are coming in too late, with too much to do.
Kudos then to the handful of players in the top 25 run scorers with a SR>120 and a boundary % greater than 55%.
PLAYER
RUNS
AV
SR
%4&6
L Harris
270
22.5
205
84.00%
A Gardner
339
28.25
151
63.00%
EA Burns
295
32.77
145
63.00%
DN Wyatt
263
20.23
129
64.00%
A Capsey
259
25.9
129
58.00%
AJ Healy
330
25.38
125
60.00%
BL Mooney
434
43.4
121
57.00%
EA Perry
408
40.8
120
56.00%
The stand out names? Harris, Gardner and Perry; because they bat down the order after the top order have chewed up lots of balls (scoring slowly).
Looking outside the top 25 runs scorers provides a vision of a different future. There were 6 other batters with more than 75 runs and a SR above 120:
PLAYER
SR
Boundary %
Av BF per innings
Flintoff
166
60.00%
10
Brown
162
67.00%
11
Ecclestone
159
56.00%
9
Kapp
143
66.00%
16
Jonassen
135
49.00%
9
Johnston
123
68.00%
7
How then to hit bigger scores? The starting point has to be to differentiate between scoring rates which are capped by a player’s skill levels and those which derive from the position they bat (top 4 dependency).
The (few) international top order batters who can take advantage of the powerplay must open, but partnered by players with defined roles to take on the bowlers and the limit on out fielders. ‘Success’ has to be to be measured in terms of SR, not average. Imagine the team willing to open with batters like Laura Harris (batting for 4 overs with field restrictions instead of just 2 during the ‘Surge’), Flintoff or Ecclestone with complete freedom from ball 1. Some games it will come off and most it won’t. When it does the team score will surge above the 145 and the team will probably win. In those games a team’s experienced International players will come in later – but with a different role (akin to that which Kapp and Jonassen perform). And when your hard hitters fail, they won’t have wasted many balls and the more traditional players can rebuild and aim for a defendable 140.
With over 20 games now in the bank, thanks to the ever-awesome cricsheet.org, we have the chance to look at how the new WBBL Power Surge is working out.
The Power Surge has come into the Women’s BBL for the first time this season, meaning a reduced powerplay (overs 1-4) and then a second two-over powerplay taken by the batting side sometime during the second half of the innings – the Power Surge.
Here are the average run rates for the games we have so far:
Phase
Run Rate
Innings
7.0
Powerplay
5.7 (-1.3)
Power Surge
9.4 (+2.4)
As we can see, the initial powerplay is typically slower than the overall run rate, by more than half a run per over – this is normal in women’s short-form cricket (though The Hundred this year bucked that trend).
But the Power Surge shows an increase in the overall run rate, of two-and-a-half runs per over – ie. five runs overall.
However, these calculations do mask a difference between the first and second innings.
Here are the numbers for the first innings:
Phase
Run Rate
Innings
7.2
Powerplay
5.7 (-1.5)
Power Surge
10.0 (+2.8)
So in the first innings, the increase is closer 3 runs per over – about five-and-a-half runs overall.
Meanwhile in the second innings:
Phase
Run Rate
Innings
6.8
Powerplay
5.7 (-1.1)
Power Surge
8.8 (+2)
In the second innings, the Power Surge bonus is significantly smaller – just 2 runs per over, or four runs overall.
The Power Surge was imported from the Men’s BBL where the numbers are similar – an overall increase in the Run Rate of around 2.7 runs per over, or a little over five runs per innings. In both cases it is essentially one extra boundary per innings.
Can you really call that a “Surge”? I guess if you are in marketing you can call it anything, and I freely admit that “Power Blip” doesn’t have quite the same ring to it, but in terms of the numbers a “Power Blip” really is all it is.
In yesterday’s ODI between England and India, India won the toss, and chose to bat second. This proved to be a good call on the day – they won the match with 5 overs to spare. But exactly how much of an advantage is winning the toss?
We looked at 100 ODIs between the “Top 5” (Australia, England, India, New Zealand & South Africa) since 2017 to find out what the data tells us*.
Intuitively, winning the toss feels like it ought to be A Good Thing™ – it’s called “winning” for a reason… right?
But surprisingly, the first thing that leaps out is that the team that wins the toss usually loses the match.
Match
Toss
Won
Lost
Won
45%
55%
Lost
55%
45%
If your instant reaction to this is that I must have got my numbers wrong… welcome to the club – that’s what I thought too!
So let’s take England. They played 45 of the matches in the dataset, winning 25 of them – i.e. a win percentage of 56%. Across those matches, England won the toss on 26 occasions, winning just 12 and losing 14 of those games – i.e. a win percentage of 46% when winning the toss.
So it’s true – England are 10% less likely to win the match when they win the toss.
What’s going on then?
The toss is obviously a binary choice between batting and bowling; but these choices aren’t equal.
WG Grace is alleged to have said: “When you win the toss – bat. If you are in doubt, think about it, then bat. If you have very big doubts, consult a colleague then bat.”
But this definitely isn’t correct for modern women’s ODIs between the top sides, where the team batting second are much more likely to win the game.
Match
Bat
Won
Lost
1st
38%
62%
2nd
62%
38%
This only applies to women’s ODIs between the top sides. In the RHF Trophy for example, there is a small (54%/ 46%) advantage to batting first.
So the numbers tell you that in Women’s ODIs, if you win the toss you “should” bowl, as indeed most captains do – 63% of the time, the winner of the toss chooses to bowl.
Toss
Bat
Bowl
Won
63%
37%
What appears to be happening is a very human thing – captains know the data, but they frequently think they are smarter than the data.. and they aren’t: when they defy the data and chose to bat, they lose almost ¾ of the time!
Toss
Won
Lost
Bat
27%
73%
Bowl
56%
44%
Interestingly, there is another way of “proving” (in inverted commas) that this is correct. Australia are the most data-driven side, and Meg Lanning is the most data-driven captain, and they almost always choose to bowl when they win the toss. On the 16 occasions they won the toss, they chose to bat on just three occasions – opting to bowl 81% of the time – THEY KNOW WHAT THEY ARE DOING! (And the only two matches they lost out of the 16 games where they won the toss were two of the three occasions where they chose to defy the data and bat!)
So the bottom line (literally in this case) is that winning the toss is only an advantage if you make a sensible choice… and that choice is: When you win the toss – bowl. If you are in doubt, think about it, then bowl. If you have very big doubts, consult a colleague then bowl.
———-
* Data includes almost… but not quite “all”… of the matches played between the Top 5, 2017-22 – thanks, as always, to cricsheet.org for the data!
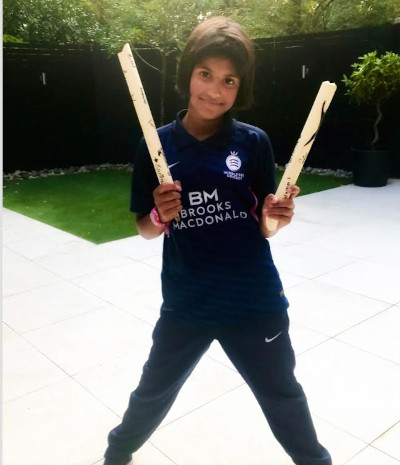
Dia Nair is 13 years old and already knows what she wants to do when she finishes school: “I want to play cricket for England.” Judging by the collection of trophies she shows me during our interview, it’s an ambition that could well be within her grasp.
Last year, Dia was named Colt of the Year by her club, Hampstead CC. It means that already, aged 13, she is considered to be the best cricketer under 16 – boy or girl – who plays at Hampstead. For a club which is one of the biggest in London and which, according to Play Cricket, fields 21 junior teams, that is quite some feat. In 156 years of the club’s history, Dia is also the first girl ever to win the award – “I was really proud of that,” she says.
Dia is an all-rounder, though she describes pace bowling as her “stronger point”; last season she hit her highest county score to date, 63 not out for Middlesex against Surrey, as well as taking “quite a few five-fors”. She nonchalantly drops into the conversation that: “I swing it both ways” (Anya Shrubsole eat your heart out!) She’s never been clocked on a speed gun, but at the age of 10, she bowled the ball so quickly in a match for Middlesex against Hampshire that she broke a stump clean in half. She still has the two pieces.
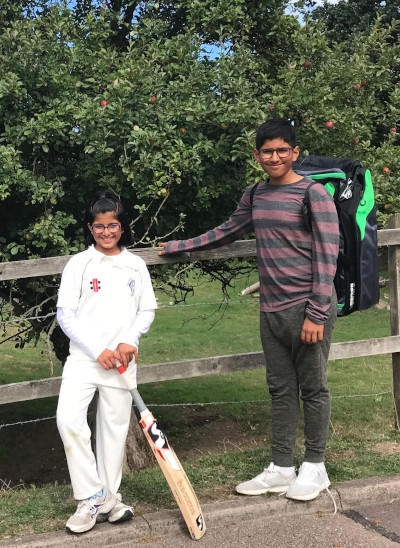
In some ways, Dia’s is a familiar story. She grew up playing cricket with her older brother in the garden at home, encouraged by two supportive parents – her mum also played as a girl growing up in India. Asked to name an inspirational coach, Dia immediately says: “My brother!” At the age of nine, she followed him to the local club (Hampstead); not long afterwards, she was sent to Middlesex trials, and made the Under-13s county side.
Dia Nair with her older brother, taken on the day she went to Middlesex trials
As a talented junior, she regularly plays for Hampstead’s boys teams, and just as Charlotte Edwards did three decades ago, she still sometimes encounters surprise when she turns up to open the batting or the bowling against an all-boys opposition. “They are always not expecting me or the other girls in my team to be quite as good as we are!” she says. Has she ever got one of them out? “Yeah, yeah,” she says, casually. “Most games!”
Has anything changed since the 1990s, then? Quite a lot, actually. For starters, there are enough other girls around to mean that Hampstead can turn out entire girls’ sides. The county structures in place for girls like Dia are also unrecognisable – she does a full programme of winter nets for Middlesex, and receives individual feedback every time. And she is benefitting from opportunities to play at school – she attends South Hampstead High School, who reintroduced cricket in 2018, and was recently named as a reserve in the Under-19s Girls’ Day School Trust team – one of the youngest players in the running for the squad.
“When I went to my GDST cricket trials all the girls there were really, really good, and it was a surprise – it was really nice to see,” she says. “And some of the older girls were saying how a couple of years ago when they trialled there were barely any people, and there were about 50 when I went and that was really cool.”
The interest is helped along by the fact that women’s cricket is regularly on TV these days. Dia watched the recent World Cup with her mum, cheering on England, and says she wants to bat like Heather Knight (although she also cites Ben Stokes, MS Dhoni and Sachin Tendulkar as role models).
And of course there is now a regional structure in place – and with it, a real opportunity to go professional in just a few short years. Dia tells me, excitedly, that when she moves up to the Under-15s Middlesex team next year, “they start scouting for professionals, and our performances get recorded, so if we play really well we might get selected for this thing called Sunrisers!”
“I think that would be really cool,” she adds. She’s not wrong. There is not much that is cooler than hearing a girl like Dia talk about her ambitions to play cricket professionally, and knowing that the new domestic structure is providing the opportunities for her to do exactly that.
For now, she’d better keep hold of that broken stump – the pieces might be worth quite a lot of money one day!