Year: 2022
The CRICKETher Weekly – Episode 144
On the CHRISTMASher Weekly:
- Reflections on England v West Indies
- Meg Lanning’s comeback
- Raf reviews The Bodyline Fix by Marion Stell
EXCLUSIVE: Inequitable Treatment of England U19s Revealed
With the inaugural Women’s U19 World Cup just weeks away, CRICKETher has learned of severe disparities in the treatment of the England Women’s and Men’s U19 squads over the winter.
The England Men’s U19s have just returned from two weeks together doing “warm weather” training in Abu Dhabi. In the new year they will travel to Australia for a month-long tour, playing Australia Men’s U19s in two Youth Tests, three Youth ODIs and one Youth IT20.
By contrast, the England Women’s U19 squad have spent the entire winter at Loughborough training indoors, with “warm weather” opportunities ahead of the World Cup quite literally non-existent.
In a recent piece on the ECB’s own website, new Men’s U19 Head Coach Michael Yardy says: “At this level it’s really important that we’re able to offer a range of experiences that can add value to a young player’s development.“
It begs the question – why deny those experiences to a group of young women of the same age? Are they somehow less worthy of having their development enhanced?
It makes even less sense given that the women will have had far less opportunities so far in their careers than their male counterparts, who are almost all embedded in professional county structures by the time they are selected for the Young Lions. In addition, the U19 women are about to compete in a World Cup against sides who have been playing competitive cricket throughout the English winter.
If budgets were a concern, the money being spent on sending the men to Abu Dhabi presumably could have been split between the two squads and used to send both sides “short-haul” for warm weather training.
Can there really be any excuse for such enormous disparity in the treatment of the two junior set-ups?
The CRICKETher Weekly – Episode 143
This week:
- England vs West Indies: Big wins for England, but is there a but?
- India vs Australia: Whoever wins… England lose!
- Broadcast rights are (still) a mess
The CRICKETher Weekly – Episode 142
This week:
- England smash West Indies
- Injury setbacks for Capsey & Kemp
- Farewell to Mignon du Preez & Carla Rudd
- Have we missed an opportunity for red ball domestic cricket?
WBBL08: Lessons Learnt and Trends – Everything Else
Part 3 of 3 in a series reflecting on WBBL08 by guest writer Andy Frombolton
Who gives a (bat) flip?
Received wisdom is that batting second in T20s constitutes a considerable advantage. However this presumes that teams are good at chasing. And also that team strengths are broadly equivalent .
What’s the WBBL data when teams win the toss?
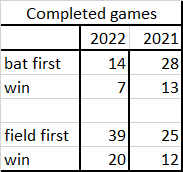
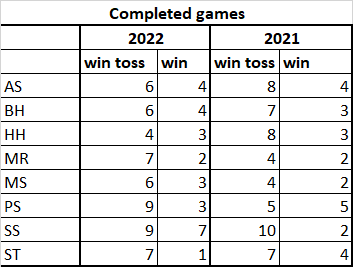
Thus on average teams win half the time whether they bat first or second but behind the headline figures are some big differences by team in terms of strategy and success. For example, in 2022, Renegades won the toss 7x, fielded 7x and lost 5x, whilst Stars won the toss 9x and fielded first every time (3 wins, 3 losses, 3 NR).
If any team displays a strong preference, it’s fairly obvious what the oppositon is going to do when they win the toss. Also, if a team’s whole strategy is built e.g. around chasing, how will they ever develop their ability to post a score?
Most interesting is Sixers’ transformation from the least-successful flippers to the best. In contrast, Scorchers went from winning every game when they won they toss last year to losing two-thirds in 2022!
The bat flip doesn’t really make much of a difference – the best teams tend to win whether they bat or bowl first and vice versa.
All-rounders
Professionalism will invariably decrease the viability of someone being an all-rounder since to be a world-class batter or bowler will require specialism for all but the most gifted.
Hence genuine all-rounders will be increasingly rare and conversely desirable in team selections.
How many players make it into the top 25 lists (most runs and most wickets), and who are they? Some of the answers may surprise …

Long term presence Devine had a poor season – a SR of less than 100 (compared to a usual 128+) and just 8 wickets. McGrath just missed out on batting honours (26th) but injury precluded her bowling as much as previous years.
Knight (2020), like Edwards and Root before her as England captains, has tended to underbowl herself. It’ll be interesting to see whether she bowls even less after her hip-surgery which would be a great shame since she’s an (undervalued) all-rounder.
Career resurrections – Perry and Healy
Going into this tournament the T20 careers of both these great players looked like they were in terminal decline when you looked at their WBBL performances. Perry didn’t make the CWG squad but found some form in The Hundred, whereas Healy’s miserable WBBL07 form continued right through until this tournament.
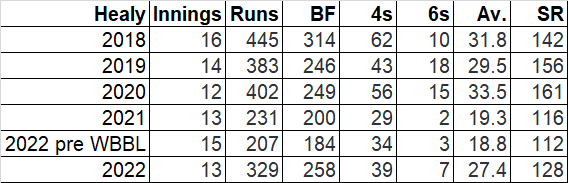

(2022 stats include all T20s for Australia and The Hundred)
Beyond the treat for all cricket fans of seeing these two on the world stage for a bit longer than they might have feared, the broader message is that older players can adapt their games for the modern game.
As discussed in Part 1 Perry, Jonassen and Kapp are great examples of how many older players could be much better deployed in the middle/late overs using their great game experience to pace and judge the innings and with the freedom to play which this new role could bring.
Wicket-keeping standards
In the women’s T20 game, keeping is as much about keeping batters in their crease as taking stumpings but far too few keepers appeared confident in going up to the stumps for the medium pacers. Healy (and previously Sarah Taylor) repeatedly showed how it limits many batters’ options.
Overall though too few of the keepers are athletes – tending to remain fairly static and waiting for a return over the top of the stumps. Keepers need to ‘own’ the area behind them 20 degrees either side of the stumps and whilst comparisons with the men’s game aren’t always relevant in this instance there’s no reason why the best women keeper can’t emulate the standards of the best male keepers who regularly beat fielders not wearing pads to snicks and tickles heading for the boundary.
Heaven help the opposition when Australia finally select the Harris siblings
Their stats say it all.
Is there any other country where Laura Harris wouldn’t be in the national team by now?
Pedestrian powerplays
The average figures were:
- 23.9 for 1 wicket 1st innings
- 23.6 for 1.1 wickets 2nd innings
In the first innings, 6 of the teams hovered around the average. Sixers were the only team with a materially better average PP (27) and Thunder the only team with a materially worse average PP (20).
In the second innings the stats were slightly more spread out, Hurricanes and Thunder both had materially better average PP (28). Heat had a materially worse average PP (19). But the surprising outlier in all the data was Sixers with an average PP of just 16!
Overall, these figures are far too low. The PP should be the launchpad for the innings but as discussed the batters either don’t have the skills (or feel they can take the risk) to take on the bowlers and take advantage of the fielding restrictions. The answer is simple – either the current batters need to change their mindset or teams need to deploy different openers.
And finally … the ultimate TFC
In the shorter format there will inevitably be squad members who don’t get the opportunity to do much with the bat or ball, but one player’s figures stood out above all others this year. Angelina Genford of the Sixers: 15 matches, 3 innings, 7 balls, 4 runs and 3 separate bowling spells totalling 4-0-36-1.
WBBL08: Lessons Learnt and Trends – Bowling
Part 2 of 3 in a series reflecting on WBBL08 by guest writer Andy Frombolton
Teams posting 140 or less lose 3/4 of their games. Hence any bowling attack which can regularly restrict the opposition to this figure will win the vast majority of games. Chasing down 140 requires a collective SR of just over 110 (well within the capability of even the most pedestrian batting line up) whereas restricting teams to such a low total is much harder.
Hence this article posits that when assembling a team the priority should be securing the best bowling unit.
This is the total opposite of what happens today, with teams competing for the best domestic and international batting talent and generally being far less interested in ‘pure’ bowlers (especially overseas bowlers). The other noticeable theme is how many uncapped players feature in each year’s Top 25 wicket takers list (or conversely how often ‘marquee’ names disappoint).
| YEAR | NUMBER OF FORMER AND CURRENT* INTERNATIONAL PLAYERS IN TOP 25 WICKET TAKERS | |
| 2022 | AUSTRALIAN | 8 |
| OVERSEAS | 4 | |
| 2021 | AUSTRALIAN | 10 |
| OVERSEAS | 3 | |
| 2020 | AUSTRALIAN | 7 |
| OVERSEAS | 7 | |
| 2019 | AUSTRALIAN | 13 |
| OVERSEAS | 3 | |
| 2018 | AUSTRALIAN | 7 |
| OVERSEAS | 5 | |
* as of the relevant season
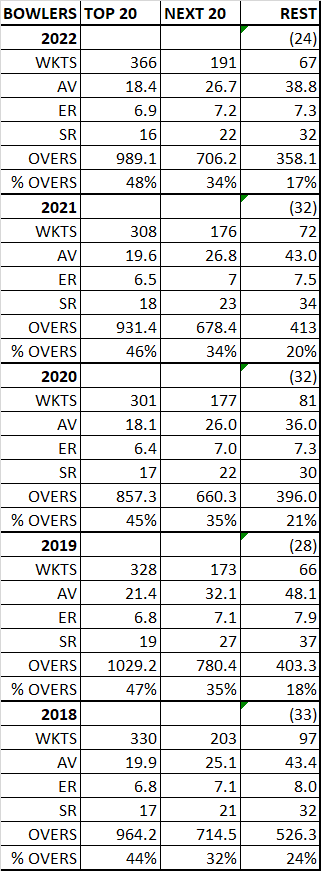
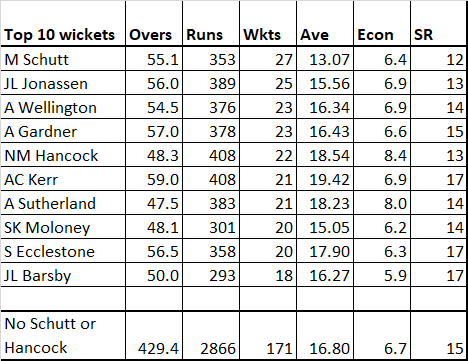
So, who were this year’s highest wicket takers?

What then constitutes a good bowling unit?
The first point is that, as noted above and unlike batting, international bowlers often don’t deliver the sort of performances expected. The stats are damning – in the past 5 seasons only 4 international bowlers (as opposed to all-rounders) have made it into the table of ‘Top 25 wicket takers’ (Tahuhu 2018, Glenn and Ismail 2020, Ecclestone 2022) (And Ecclestone should be an all-rounder!). So unless a team can secure the services of one of the top 3-4 overseas bowlers in the world the evidence suggests they’d be better off saving their money.
Equally interesting are the Economy Rates (ERs). Shouldn’t the ‘best’ bowlers have better ERs than the other bowlers? In fact, the ERs of the top 20 wicket takers, the next 20, and of all other bowlers are virtually the same and converging. In the past 3 years, the best bowlers are going for slightly more runs, the ‘change’ bowlers are holding steady and the bits’n’pieces bowlers are bowling less but becoming more economical.
Running counter to the men’s T20 game (where slow bowlers dominate the best ER tables and faster bowlers the best SR tables) the 2 best* (*rationale follows) bowling attacks in this year’s tournament (Adelaide Strikers and Brisbane Heat) employed very different approaches.
Adelaide Strikers: Schutt (fast), Wellington (slow), Barsby (slow), D Brown (fast) and Dottin (fast medium).
Of these, the hitherto-unspectacular Barsby was a revelation and is additionally interesting for being one of the new breed of ambidextrous slow bowlers (her occasional left arm accounting for Alice Capsey in one game).
Brisbane Heat: Jonassen (slow), Hancock (medium), A Kerr (slow) and Sippel (medium).
More important seemingly than the composition of the attack is that bowlers know their role and learn to bowl as a unit, which is what makes Adelaide Strikers truly unique – their 5 main bowlers bowled 92.6% of their overs i.e., the same 5 players bowled their full complement of overs in virtually every game. The closest analogy I can think of is the all-conquering Gloucestershire men’s side of the early 1990s. Similarly Heat had 4 bowlers who delivered 72.1% of their overs. Contrast this to Sixers whose core 3 bowlers always bowled their full allotment (59.4% of overs) but the bulk of the balance was shared between 4 bowlers. Sixers might counter that their approach demonstrated flexibility and greater depth in their bowling attack.
This is another area where performances in the women and men’s game diverge and hence so should tactics. In the men’s game, the best way to slow down the run rate is to get the top batters out (such is the difference in the SR of the top 4 batters compared to the next 4) which means teams need strike bowlers to perform this role (their ER being of less concern), but in women’s cricket (as discussed in the previous article) overall batting SRs are lower and hence dismissing a top batter has less impact (quantum) on a team’s eventual score.
Thus if bowling SR was the key determinant of an opposition’s score then Sixers might have a claim to have the most penetrative bowling unit. Sixers have 5 of the 23 bowlers (≥5 wickets) with a SR<20 with all the other teams having 3 (except Renegades which had 0, which perhaps explains why they conceded the 1st, 2nd and 4th highest scores in this year’s tournament).
But if instead keeping the run rate down is the priority, then a team needs a bowling attack able to do this consistently in all scenarios. Strikers’ top 4 bowlers had a combined ER of 6.4; far better than any other team and only once did a team batting first get on top of them (Stars’ 186, 3rd highest score of this season), otherwise they conceded 4 scores in the range 151-154 and 4 in the range (101-114). And when defending Strikers never got hit for more than 139.
Based on consistency and dependability, Strikers were the best bowling team and thus deserved champions.
The silver bowling award goes to Heat who bowled well in the first innings (only once conceding more than 140) but conceded more than 156 four times bowling second. It was their potential to wilt under pressure (not helped by some poor fielding at key moments) which cost them games.
Sixers also got hit for above par scores five times (three times bowling first and twice bowling second, although they went on to win 4 of these games so could contend this was ultimately irrelevant. The counter argument is that no team, however good their batting line-up, can afford to concede these sort of scores.) Equally telling was the three times they got taken apart in the death overs and only clinched victory each time courtesy of some equally-brutal hitting in their final overs. (Game 1, Heat hit the last 2 overs for 18. Sixers hit 19 off 11 balls; Game 42, Scorchers hit 22 off the last 2 overs, Sixers hit 23 off 12 balls; and Game 49, Heat hit 37 off the last 2 overs (and 47 off the last 3) and Sixers hit 28 (and 41). Hence their honourable bronze position in these bowling awards.
In concluding, what therefore would be the perfect bowling attack look like?
Look again at the list of top wicket takers. The stats say it all. Slow bowlers dominate the wicket-taking tables – 8 of the top 10 (with a collective ER of 6.7 and a SR of 15).
So team selection should start with a fielding set up capable of supporting your bowlers – a superb keeper and a minimum of three fielders who are great in the deep (trading a degree of run scoring ability for fielding prowess if necessary).
You need a fast bowler? Schutt, D Brown, Sippel or Strano. No other fast bowler has appeared in the Top 25 for 2 years in a row so you’re just taking a gamble on any other selection having a good year.
Add 1 all-rounder (more on that subject in the third article)
And finally 3 slow bowlers (or even 4 so you don’t even need to play your fast bowler when conditions don’t suit).
And then pick some batters!
The CRICKETher Weekly – Episode 141
This week:
- The Capsey Conundrum – how do England fit her in to their XI?
- England’s vice-captaincy
- An expanded domestic fixture list for 2023… but no Lord’s final
WBBL08: Lessons Learnt and Trends – Batting
Part 1 of 3 in a series reflecting on WBBL08 by guest writer Andy Frombolton
The average 1st innings score in this year’s WBBL (in complete games) was 145, up slightly on 2021 (137).
Teams posting 144 or more in the first innings won 22/29 times whilst teams scoring 160 or more won 14/16. But the distribution of above-par 1st innings scores was highly skewed – only 3 teams managed it more than twice: Heat (7 wins from 8); Sixers (6 wins from 7); and, Hurricane (3 wins from 5). In contrast champions Adelade Strikers never posted more than 147 but defended 4 scores in the range 140-147 (twice against the Sixers) and their highest score in 6 successful chases was only 156.
The most obvious conclusion is that it’s bowling units which win games, not batters. Nevertheless batters are the focus of this first article.
There were 24 first innings scores of 150 or more (compared to 17 last season) but more interesting is who’s scoring the bulk of these runs. Intuitively you might imagine it would be the players with international experience – and this certainly used to be the case.
| YEAR | NUMBER OF FORMER AND CURRENT* INTERNATIONAL PLAYERS IN TOP 25 RUN SCORERS (*as of the relevant season) | |
| 2022 | AUSTRALIAN | 7 |
| OVERSEAS | 10 | |
| 2021 | AUSTRALIAN | 8 |
| OVERSEAS | 10 | |
| 2020 | AUSTRALIAN | 8 |
| OVERSEAS | 7 | |
| 2019 | AUSTRALIAN | 10 |
| OVERSEAS | 13 | |
| 2018 | AUSTRALIAN | 11 |
| OVERSEAS | 10 | |
Slowly, uncapped players are being given, and are seizing, their opportunities. Disappointingly however this cohort (extensively coached in power hitting and 360 degree shot making) isn’t having the impact on run rates which might have been expected.
Top 25 run scorers WBBL 2022

(Orange – Australian former and current Internationals. Blue – former and current Overseas Internationals)
With the exception of Laura Harris, the uncapped batters are scoring their runs at about the same rate as the international players they’re incrementally displacing.
| YEAR | TOP 20 RUN SCORERS | 20 NEXT MOST RUNS | REST | |
| 2022 | RUNS | 6511 | 4274 | 3109 |
| % RUNS | 47% | 31% | 22% | |
| SR | 119 | 110 | 102 | |
| 2021 | RUNS | 7301 | 3560 | 2231 |
| % | 56% | 27% | 17% | |
| SR | 116 | 103 | 95 | |
| 2020 | RUNS | 6844 | 3383 | 2070 |
| % | 56% | 28% | 17% | |
| SR | 115 | 101 | 97 | |
| 2019 | RUNS | 8457 | 4063 | 2497 |
| % | 56% | 27% | 17% | |
| SR | 121 | 108 | 101 | |
| 2018 | RUNS | 7805 | 4452 | 2853 |
| % | 52% | 29% | 19% | |
| SR | 124 | 109 | 100 |
Most teams pack their top order with dependable batters who can be relied upon to get their team to the sort of total which will win most games (144 this year, as noted earlier).
But 144 only requires a collective SR of around 112 (assuming 10 extras per innings).
So, if you’re a former international or a fringe player seeking to secure a WBBL or Hundred contract why take risks trying to score more quickly – even against weaker bowling attacks – when a pedestrian 112 will be seen as a good innings? With this attitude team scores aren’t going to grow.
In their defence, the top order could cite some statistics which seemingly justify their cautious approach:
| Bat | Result | % runs (off the bat) scored by batters 1-4 |
| 1st | Win | 75.00% |
| Lose | 53.00% | |
| 2nd | Win | 77.00% |
| Lose | 54.00% |
This seems to suggest that the team won’t win unless the top order scores the bulk of the runs. But a lot of these victories batting second were in pursuit of low scores and hence inflate the average contribution of the top order. Watching teams slowly overhaul below-par scores was a scenario seen far too often this tournament.
More relevant then is to see how the top batters cope when presented with a more challenging target. If you take the average of a team’s 3 highest first innings scores as an indicator of what they’re capable of when they play well (‘batting potential’, ‘BP’) there were only 11 occasions (in full length games) when teams exceeded their BP batting second and only 4 times did this result in a victory.
The conclusion is that most teams simply don’t know how to chase anything above an average score – primarily because their top order is full of established players playing ‘old fashioned’ cricket. Powerplays are squandered and acceleration is too slow; leaving the middle/lower order batters too much to do if the top order fail.
Comparisons to men’s cricket aren’t usually helpful, but sometimes they can serve to shine a light on issues. Looking at 2021 Blast data, the average SR for the top 4 run scorers in each team was 141, 128 for the next 4 and 113 for the rest. This raises two questions: Firstly, why aren’t the best women batters able to achieve SRs more akin to the best men batters (Mandhana and Wyatt dispel any argument that physical size is the primary explanation) and, secondly, why are the tails so long? If batters 6 onwards can barely strike at 100, then it’s little wonder than the top order batters in most teams play so cautiously (knowing that if they fail, their teams have little chance of success).
Let’s look at this year’s (4 over) Powerplays. The average PP (both innings) was 24; equivalent to a SR100 (with only 2 fielders out). That’s not good enough.
Consider 6 hitting. There were 235 6s hit in this year’s competition but just 13 batters accounted for half of them. 46 batters didn’t hit a single 6 (including 4 of the top 25 run scorers) whilst a further 16 hit just 1 (including another 3 of the top 25 runs scorers). This means that 7 of the top 25 most prolific run scorers can’t clear the ropes. Perhaps they don’t take the aerial route? Well, 8 of the 25 (including 5 internationals) score less than 50% of their runs in boundaries – which is the average for the top 85 batters!
Why is this important? Because boundaries win games. In comparison the number of singles has barely any impact. (The same hold true in the men’s game.) The one exception was the Sixer’s (record) 66 singles to beat Hurricanes despite scoring 5 fewer boundaries. Next best (65) helped propel Stars to an truly-underwhelming 114 against the same opposition!
In this year’s WBBL, 42 of the 52 full length games were won by the team which equalled or hit more boundaries than the opposition. (Regarding the other 10 games, in 4 of these the winning team only hit 1 less boundary.)
The players who can hit boundaries are coming in too late, with too much to do.
Kudos then to the handful of players in the top 25 run scorers with a SR>120 and a boundary % greater than 55%.
| PLAYER | RUNS | AV | SR | %4&6 |
| L Harris | 270 | 22.5 | 205 | 84.00% |
| A Gardner | 339 | 28.25 | 151 | 63.00% |
| EA Burns | 295 | 32.77 | 145 | 63.00% |
| DN Wyatt | 263 | 20.23 | 129 | 64.00% |
| A Capsey | 259 | 25.9 | 129 | 58.00% |
| AJ Healy | 330 | 25.38 | 125 | 60.00% |
| BL Mooney | 434 | 43.4 | 121 | 57.00% |
| EA Perry | 408 | 40.8 | 120 | 56.00% |
The stand out names? Harris, Gardner and Perry; because they bat down the order after the top order have chewed up lots of balls (scoring slowly).
Looking outside the top 25 runs scorers provides a vision of a different future. There were 6 other batters with more than 75 runs and a SR above 120:
| PLAYER | SR | Boundary % | Av BF per innings |
| Flintoff | 166 | 60.00% | 10 |
| Brown | 162 | 67.00% | 11 |
| Ecclestone | 159 | 56.00% | 9 |
| Kapp | 143 | 66.00% | 16 |
| Jonassen | 135 | 49.00% | 9 |
| Johnston | 123 | 68.00% | 7 |
How then to hit bigger scores? The starting point has to be to differentiate between scoring rates which are capped by a player’s skill levels and those which derive from the position they bat (top 4 dependency).
The (few) international top order batters who can take advantage of the powerplay must open, but partnered by players with defined roles to take on the bowlers and the limit on out fielders. ‘Success’ has to be to be measured in terms of SR, not average. Imagine the team willing to open with batters like Laura Harris (batting for 4 overs with field restrictions instead of just 2 during the ‘Surge’), Flintoff or Ecclestone with complete freedom from ball 1. Some games it will come off and most it won’t. When it does the team score will surge above the 145 and the team will probably win. In those games a team’s experienced International players will come in later – but with a different role (akin to that which Kapp and Jonassen perform). And when your hard hitters fail, they won’t have wasted many balls and the more traditional players can rebuild and aim for a defendable 140.
The CRICKETher Weekly – Episode 140
This week:
- WBBL Review – England players, the final & Charlotte Edwards’ golden touch
- Our impressions of new England coach Jon Lewis
- England squad to tour WI & the comeback of Lauren Winfield-Hill
- Syd’s thoughts (rant incoming!) about THAT £400m
